Overview
Nowadays, almost every industry undergoes issues related to harmonics due to the increase in usage of non-linear loads. As these loads are unavoidable because they perform important tasks like controlling or conversion, solutions to mitigate the ill effects of harmonics are to be devised.
These solutions include passive filters consisting of detuned inductors and capacitors or active filters that create equal and opposite waveform to smoothen actual distorted waveform. Despite the technology being used, it becomes essential to understand the severity of the predominant harmonic order e.g. 3rd , 5th or 11th . To understand this a tool to view individual harmonics is required in any power quality analysis device.
Problem Statement
Presence of harmonics in the power supply received at home (residence) or in industries is due to non-linear loads for example induction motor speed control drives, CFL and LED lights, UPS systems, etc.
Most of the tools/ measuring devices nowadays have the provision of indicating harmonic content with the help of THD (Total Harmonic Distortion) feature. Though THD is a useful tool to determine overall harmonic level it does not provide a detailed picture of what magnitude and degree of harmonics is present in the system. Neither the dominant harmonics are highlighted. Therefore, a tool which can represent individual harmonics is essential for detailed analysis and mitigation.
Solution
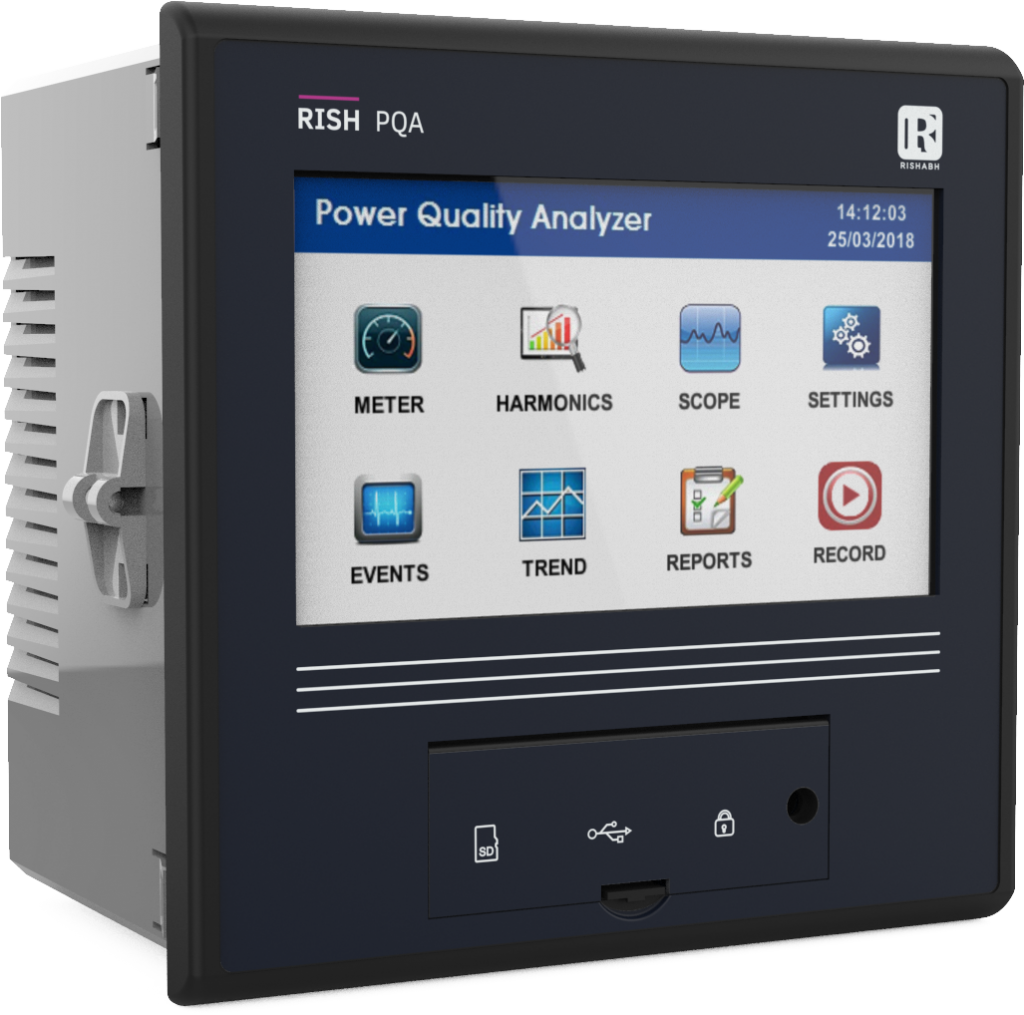
Rish PQA is able to measure distortions or uncharacteristic changes in the waveform of original signals. Distortion calculation measures the deviation of complex wave shape from pure sine waves.
Voltage and Current for each phase can be measured under the user frequency meter icon. Frequency (50Hz or 60Hz) can be set and corresponding voltage and current harmonics can be measured.
- THD (Total Harmonic Distortion): THD is defined as the ratio of the sum of the powers of all harmonic components to the power of the fundamental frequency. Rish PQA can measured voltage as well as current THD normalized to the fundamental frequency with the help of following formula (as per EN 61000-4-7) effectively :
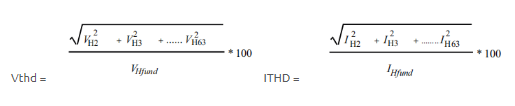
- Harmonics: Harmonics display the amplitude and phase of each harmonic up to 63rd order in both graphical and textual format. Harmonic screen displays voltage, current, power harmonics. Harmonics are integral multiples of fundamental frequency. The harmonic analysis is done by a synchronous window of 10 cycles for 50 Hz and 12 cycles for 60Hz. Summary values of odd, even and total distortion are displayed.
Bar graph representation of individual harmonics :
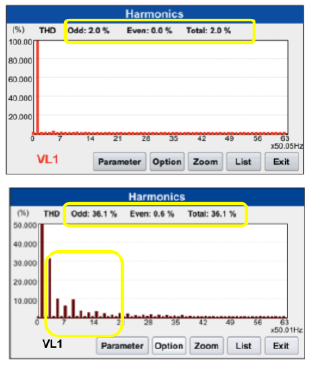
The majority of the screen consists of the actual harmonic bar chart display of V, I, P along with a numeric listing of harmonics as shown below.

The above representations help understand the predominant orders of harmonics which further help to design mitigation techniques/tools for e.g. filters.
Features
- Measures all basic electrical parameters like Voltage, Current, Power, Demand and Energy
- Energy Class 0.2S as per IEC 62053-22
- Measurement in all Four Quadrants
- 5″ TFT Display with 480×272 pixels resolution
- Real Time Representations of Three Phase Voltage and Current Waveform
- Harmonics measurement as per IEC 61000-4-7 Class II
- Per Phase Voltage, Current & Power Bar Graph Representation of up to 63rd Harmonic
- Power Configurator software to analyze recorded events and trends, and to generate excel report as per EN 50160